Brazilian E-Commerce Public Dataset by Olist
Project Overview
This project was developed as an end-to-end Business Intelligence solution with the goal of designing and building a complete data pipeline, from raw data ingestion to dashboard delivery.
Starting from publicly available Olist e-commerce datasets, the objective was to transform a normalized, OLTP-style data structure into a robust OLAP analytical model capable of supporting business reporting. The focus was not only on visualization, but on building a solid, scalable, and reliable data architecture, ensuring data consistency, performance, and maintainability.
The final output is an interactive Power BI dashboard powered by a structured BigQuery backend, enabling analysis of key business metrics such as revenue, order volume, customer behavior, and operational performance.
Design idea
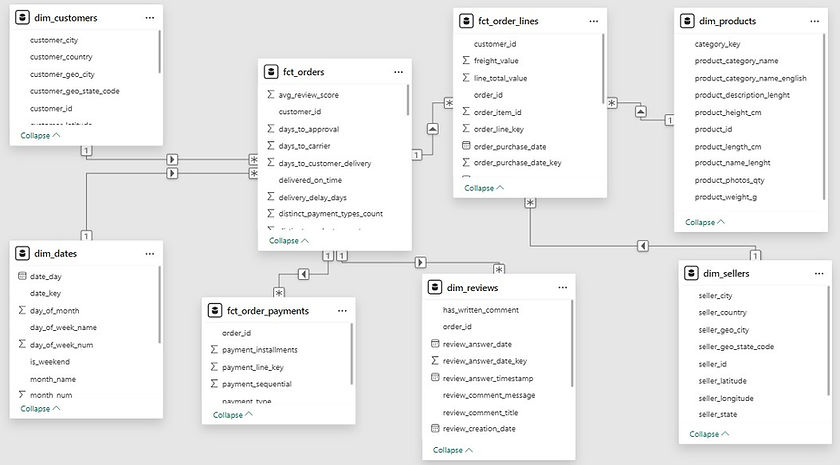
The project design is based on the transformation of a raw OLTP dataset into a star schema (OLAP) optimized for analytical workloads (shown in the image below)
Execution and implementation
The transformation pipeline was implemented entirely in BigQuery SQL, following a modular and production-oriented structure aligned with modern BI engineering practices. Key implementation steps include:
-
Data cleaning and normalization using functions such as TRIM, UPPER, INITCAP, and SAFE_CAST
-
Explicit definition of table grain (order-level, item-level, payment-level)
-
Aggregation of transactional data into business-level metrics such as revenue, freight, item counts, delivery performance, and payment signals
-
Construction of the main fact table (fct_orders) by combining and aggregating multiple raw sources (orders, items, payments, reviews)
-
Implementation of partitioning (by date) and clustering (by high-cardinality fields) to optimize query performance and reduce processing costs
-
Creation of a semantic layer (views) to centralize business logic and ensure metric consistency across the dashboard
-
Creation of a physical aggregation layer (agg_*) to support high-performance queries for frequently used dashboard views
To ensure data quality and reliability, validation checks were implemented, including:
-
Uniqueness checks on primary keys
-
Referential integrity checks between fact and dimension tables
-
Reconciliation logic between order-level totals and payment-level values
The final model was then connected to Power BI, where the data is consumed through a clean semantic layer and visualized in an interactive dashboard.